|
Temperature
These are the estimates by climate scientists (based
on many kinds of measurement) for the global air temperature,
the average temperature of the atmosphere above all lands and seas.
(In degrees Celsius; to convert to Fahrenheit, multiply by 1.8 and
add 32.) A seemingly small difference such as 0.1° C implies
a vast amount of extra heat in the air.
13.6°: approximate level in 1850.
13.66°: mean for 1850 to 1899.
13.75°: same for 1900 to 1960.
13.97°: same for the 30-year period 1961-1990 (usually quoted
as roughly 14°, and being used as a baseline for many figures
now given).
14.24°: same for the decade 1990-1999.
14.42°: same for 2000-2008. (About 0.75° above the 19th-century
level.)
15.6° (about 2° above the 19th-century level): the
highest possibly safe point, or more realistically the tipping
point which it would be folly to reach: global temperature at
which there would be a 50-50 chance of preventing runaway heating.
Others (such as the governments of several nations already harmed
by rising oceans) would rather set this safe limit 0.5° lower.
20° (6° or 7° above the 19th-century level): probable
level reached in the 21st century if present trends (middle estimate)
continue.
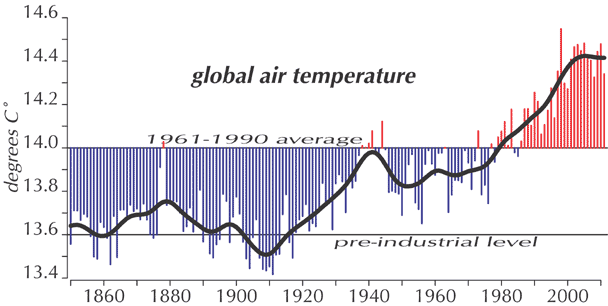
This graph shows the atmosphere's general temperature over the span for which records have been kept. A horizontal line indicates the approximate level for pre-industral times; another, the 1961-1990 average, now being commonly used as a baseline. The blue lines down, and the red lines up, show for each year the “anomaly” or difference from this baseline. The black curve shows the mathematically “smoothed” values. Graphs of this sort (like that given by the University of East Anglia's Climatic Research Unit, on which my graph is modeled) comventionally indicate the anomaly instead of the absolute temperature, but the difference is only in the labeling (“0.0°” instead of “14.0°”), and I think the absolute figures are easier to understand.

Graphs like this show a general trend, but also many smaller-scale
up-and-down jags, due to secondary factors, such as volcanic eruptions,
which can cause cold years by putting dust into the upper atmosphere.
These are the 20 hottest years of the more than a century
and a half on record.
1998 14.548°
2005 14.482°
2010 14.478°
2003 14.475°
2002 14.465°
2004 14.447°
2009 14.443°
2006 14.425°
2001 14.408°
2007 14.402°
1997 14.352°
2011 14.340°
2008 14.325°
1999 14.297°
1995 14.275°
2000 14.271°
1990 14.255°
1991 14.213°
1988 14.180°
1987 14.179
These include every year from 1995 onward. And not one from before
1987.
The best estimate now
(by the Canadian Earth System Model, 2011) is that if by 2100 we
were to end humanity's excess emission of carbon dioxide by ending
deforestation and all use of fossil fuels, it would take at least
till 3000 for the Earth to recover from the current warming trend.
return
|


